Project delivered
Predicting without training
CatBoost against Kumo-Tabular on Seattle building energy consumption: a tabular foundation model seems to do better without training, for 25 seconds per call. Four experiments to check, and what that says about use cases, cost, and what's left to the craft.
· Period: 8 → 18 Oct 2026 · 16 min read
- Machine Learning
- Tabular foundation models
- MLOps
- CatBoost
- Deployment
For project 5 of my AI Engineer course, I had to deploy a machine learning model in production: an API, tests, a database, monitoring. The model predicts the energy consumption and CO2 emissions of non-residential buildings in Seattle. I trained a CatBoost, then compared it to Kumo-Tabular, an NVIDIA tabular foundation model that doesn't train: it predicts from examples you give it on every call. On this dataset, it seems to do better, for 25 seconds per call. I then ran four experiments to check my hypotheses: they noticeably temper that first result. Here's what I measured and what I take from it.
- Kumo-Tabular's R² on energy, with no training, against 0.24 for CatBoost
- 0.45
- a single building, a data center, carries this whole lead: without it and without the biggest industrial site, CatBoost pulls back ahead
- 1 / 310
- for a Kumo prediction on CPU (4 threads), against 0.8 ms for CatBoost
- 25.5 s
- for 1,000 Kumo predictions in a single call: the cost comes from the context, not the number of rows
- 42.5 s
- error on emissions with a badly built context: for Kumo, the context plays the role of the model
- × 528
- context rows: CatBoost still improves, Kumo plateaus and costs almost 4 times more than at 1,236
- 4,700
The delivered project
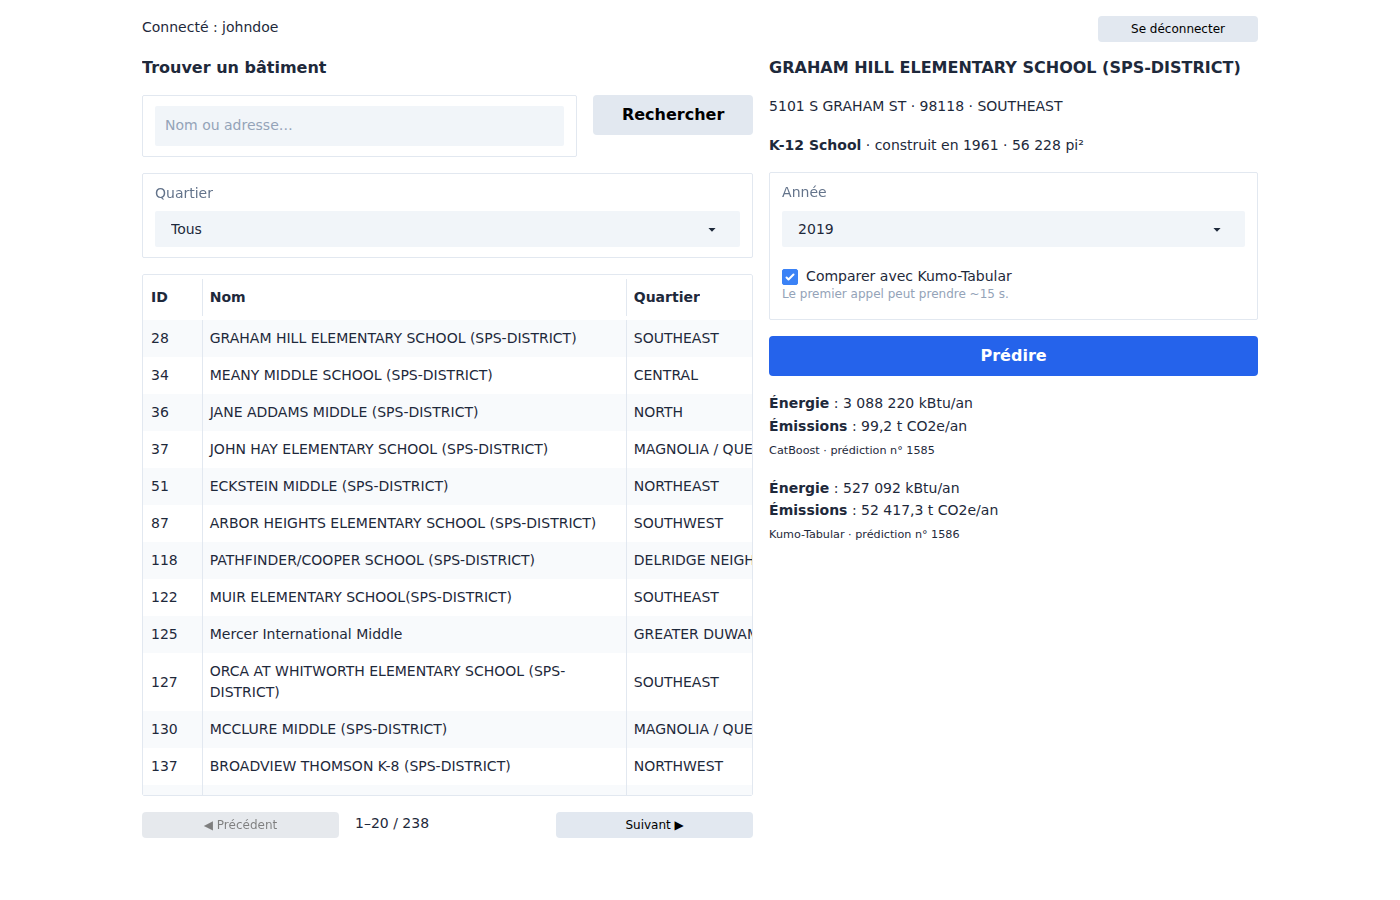
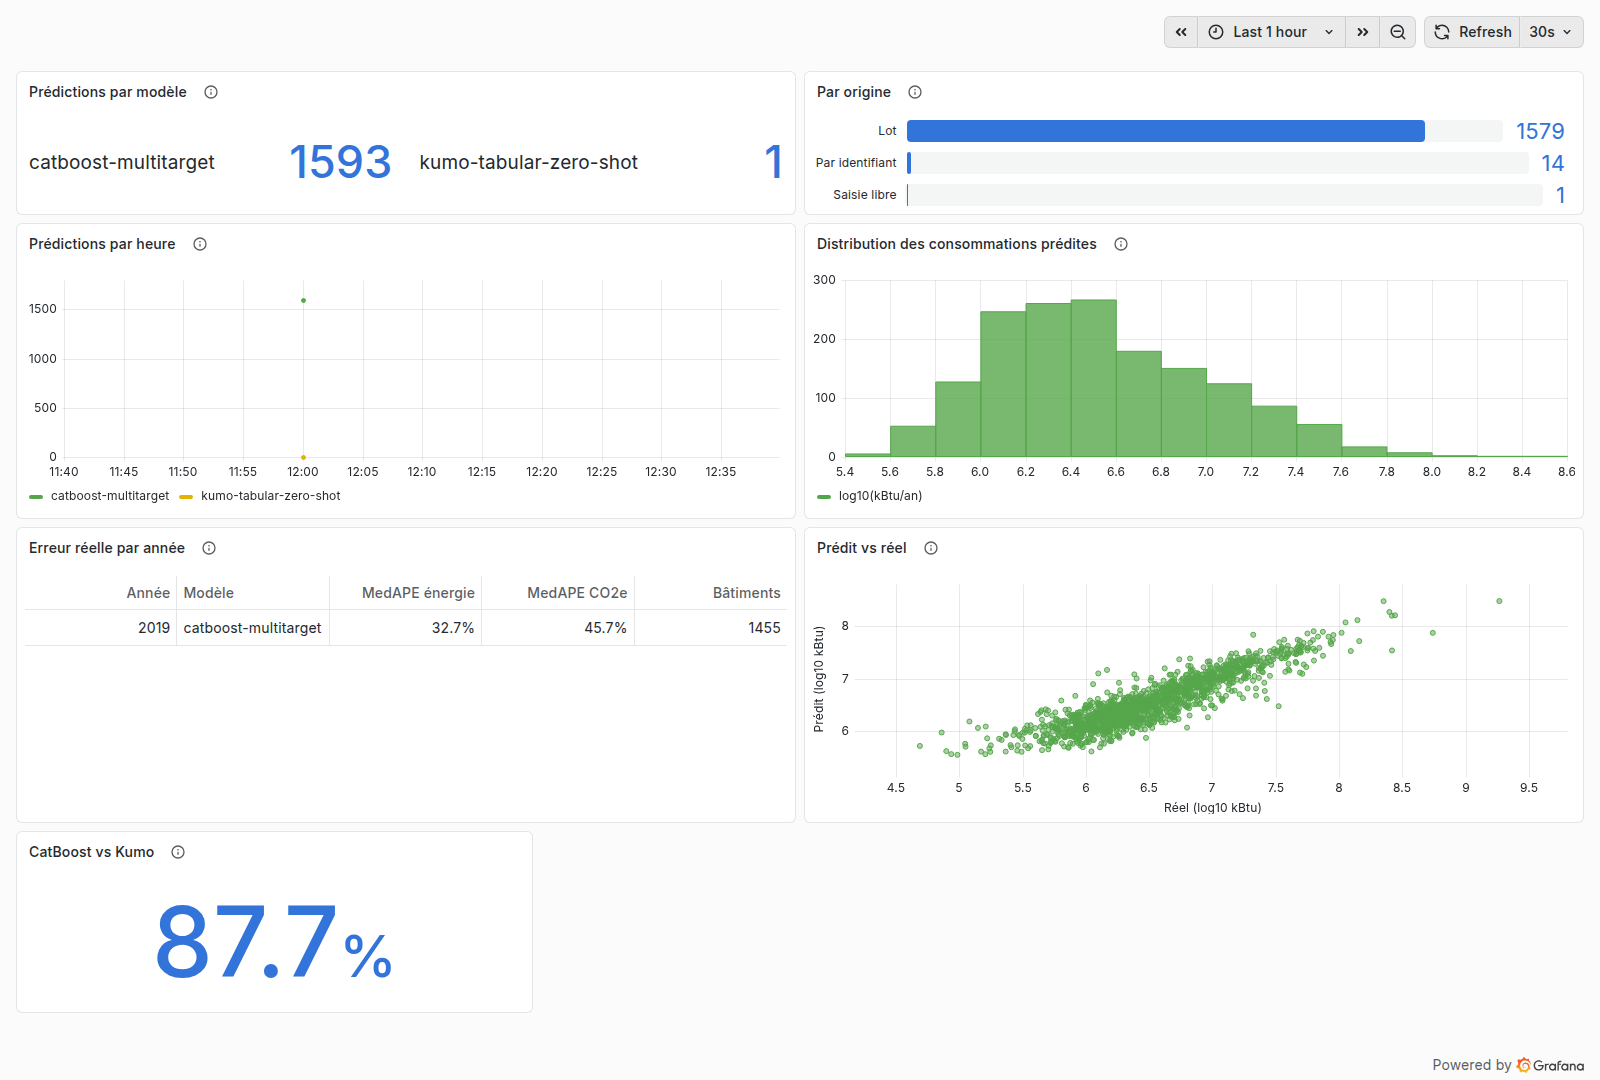
The scenario: a client wants to make their model “usable in production”. I delivered a FastAPI API authenticated by JWT, backed by PostgreSQL. Every call and every prediction is traced there, along with the model version that produced it. Training runs are tracked in MLflow, and two Grafana dashboards read the same database. A Gradio interface serves as a demo. CI blocks a merge if the tests, the security or the model's performance regress against the reference version.
CSV 2016 + open data 2017–2019 ─▶ ingestion (cleaning, harmonization, split)
                                      │
                                      ▼
                                 PostgreSQL ◀── MLflow (runs, metrics, artifacts)
                                 │   ▲   ▲
                 training ◀──────┘   │   └── Grafana (API, model)
     CatBoost ×2 + Kumo context       │
                    │                │ traceability: requests, predictions, versions
                    ▼                │
          FastAPI (JWT) ─────────────┘ ◀── Gradio (demo)
          /model/predict           CatBoost, a few ms
          /model/predict/compare   CatBoost + Kumo-Tabular, ~25 s
The code is on GitHub, the CatBoost model on Hugging Face and a demo runs online.
Two ways to predict
CatBoost follows the classic path. It's trained on 1,236 buildings from 2016 (17 variables: type, neighborhood, floor areas, year built, connection to natural gas or the district heating network), with cross-validation and hyperparameter search. Once trained, it fits in two .cbm files and answers in less than a millisecond.
Kumo-Tabular doesn't train. It was pretrained once and for all, and it predicts by in-context learning: you pass it labeled rows (the context) along with the rows to predict, and it reasons by analogy, without changing its weights. Its context here is exactly CatBoost's training set. So the two models see the same data, and no test building.
The scores
- CatBoost (trained)
- Kumo-Tabular (context)
| Target | Model | R² | MAE | Median relative error |
|---|---|---|---|---|
| Energy | CatBoost | 0.24 | 5.17 M kBtu | 35.0% |
| Energy | Kumo-Tabular | 0.45 | 4.71 M kBtu | 35.1% |
| Emissions | CatBoost | 0.11 | 145.9 t CO2e | 43.7% |
| Emissions | Kumo-Tabular | 0.21 | 136.6 t CO2e | 48.3% |
On paper, Kumo wins clearly on R² and absolute error, metrics dominated by large buildings. On median relative error, which weighs a small building as much as a large one, it's level on energy and worse on emissions. I had concluded that Kumo extrapolated better on the tail of the distribution. The question remained whether the gap held.
What these scores are worth
A single building makes the result. On energy, five buildings concentrate 96 to 97% of the two models' squared error, and one alone carries 65 to 76%. It's an industrial site classified as a “campus”, with a power plant and laboratories: it consumes 448 M kBtu, CatBoost predicts 36 M, Kumo 63 M. Both miss it. The second is a data center: 275 M kBtu actual, 32 M for CatBoost, 175 M for Kumo. That one, Kumo comes close.
| Buildings removed from the test (energy) | CatBoost R² | Kumo R² |
|---|---|---|
| none | 0.24 | 0.43 |
| the industrial site | 0.39 | 0.69 |
| the data center | 0.25 | 0.32 |
| both | 0.58 | 0.53 |
Without these two buildings out of 310, CatBoost pulls back ahead. On emissions, removing the industrial site, the data center and a hospital is enough to put the two models on equal footing (R² 0.55 everywhere, absolute error 72 against 71 t CO2e). Kumo's lead therefore comes down to how it handles a few extreme buildings. That's not nothing: they're the ones that weigh in a city's energy balance. But it's fragile evidence.
The bootstrap confirms it. Over 2,000 paired resamples of the test set, the 95% confidence interval for CatBoost's R² on energy runs from 0.16 to 0.75, Kumo's from 0.26 to 0.81. The gap between the two runs from −0.23 to +0.52: it's not significant. Kumo has the best R² in 90% of draws for energy and 94% for emissions. The trend is consistent, without being established. On median relative error for emissions, it's the opposite: CatBoost is better in 92% of draws.
Kumo doesn't give the same score twice. Its inference draws samples at random, and the service doesn't set a seed. Across five seeds, with the same context, its R² on energy varies from 0.42 to 0.46. The published 0.45 is one draw among others.
The context is the model
The first version of the comparison used a synthetic context: a few generated rows, with emissions set at 0.1 times the energy. In Seattle, the real ratio is about 0.00002 t CO2e per kBtu. Kumo stays close to the values it sees in context. So it predicted emissions about 500 times too high, with an R² of −1,829.
The fix didn't touch the model, only the data: the context became the real training set, exported by the pipeline and versioned with the models. That's the most concrete lesson of the project. With an in-context learning model, feature engineering becomes context engineering: which rows to give, with what representativeness, without which leak. And MLOps doesn't disappear, it moves: you no longer version weights, you version a dataset.
What a prediction costs
My initial intuition: “the dataset is reloaded on every inference, so the cost explodes with volume”. I measured it with the delivered models, on CPU, 4 threads.
- CatBoost
- Kumo-Tabular (context of 1,236 rows)
My intuition was half right. Kumo's cost depends above all on the size of the context, not on the number of predictions. One row costs 25.5 s, a thousand rows 42.5 s: 42 ms per building in batch. So the problem isn't the volume of data to predict, it's the number of calls. A batch use amortizes the context. A real-time use, one request at a time as in my API, pays it every time. And the duration of a call grows roughly linearly with the size of the context (next section).
The other lever is to shrink the context. The project's documentation announced an R² of 0.49 with a sample of 300 rows, better than with the whole set. That was a favorable draw: over three other draws, I get 0.31 to 0.37. I also tested the idea of a “tabular RAG”: giving Kumo, for each building to predict, its 300 nearest neighbors in the training set.
| Kumo context | Energy R² | Median energy error | Emissions R² | Median emissions error |
|---|---|---|---|---|
| 300 random rows (3 draws) | 0.31 to 0.37 | 42% | 0.17 to 0.26 | 54% |
| 300 nearest neighbors | 0.38 | 38% | 0.21 | 49% |
| 1,236 rows (the whole training set) | 0.42 to 0.46 | 34% | 0.20 to 0.21 | 49% |
At equal size, the neighbors beat random on every metric, without catching up to the full context on energy. The trade-off depends on the use case. For a single request, 300 neighbors cost about 6 s instead of 25 s. In batch, it's the opposite: one context per building prevents pooling, and predicting the 310 buildings takes half an hour instead of a minute.
Even optimized, the gap stays huge: per request, about 30,000 times CatBoost's latency. For an API serving thousands of requests per second, the question doesn't arise.
What about more data?
Tabular foundation models are reputed to be strong on small datasets. So I had to look for the point where CatBoost pulls back ahead. I varied the size of the training set, which also serves as Kumo's context, from 100 to 4,700 rows. Beyond the 1,236 buildings from 2016, I added the years 2017 to 2019, never including a test building. The test stays the same 310 buildings. Each point is the average of three draws.
- CatBoost
- Kumo-Tabular
| Rows | Median energy error (CatBoost / Kumo) | Median emissions error (CatBoost / Kumo) | Kumo call duration |
|---|---|---|---|
| 100 | 47% / 54% | 55% / 71% | 16 s |
| 300 | 39% / 42% | 49% / 54% | 20 s |
| 600 | 37% / 37% | 46% / 51% | 30 s |
| 1,236 | 34% / 34% | 44% / 49% | 59 s |
| 2,500 | 34% / 34% | 44% / 47% | 117 s |
| 4,700 | 34% / 37% | 45% / 48% | 225 s |
I didn't find a crossing in R²: Kumo stays ahead at every size. But that R² rests on the few extreme buildings seen above. On median error, the table says otherwise. With little data, it's CatBoost that makes the better typical prediction: at 100 rows, its median error on emissions is 55%, against 71% for Kumo. The idea that Kumo dominates with little data is true only for the extreme cases.
Beyond 1,236 rows, Kumo gains nothing more, while a call's duration keeps growing linearly, by about 48 ms per context row. Caveat: the added rows are mostly other years of the same buildings, so little new information. And CatBoost keeps the hyperparameters tuned for 1,236 rows, with no per-size tuning.
So what is a model like Kumo for?
That was my real question. Standing up an XGBoost or CatBoost training pipeline has become easy, and a coding agent does it in a few minutes. If Kumo's only advantage is avoiding training, it doesn't weigh much.
But training is only part of the cost. This project showed me that: MLflow, a performance gate in CI, model versions in the database, restarting the API after retraining. A model's real cost is its lifecycle. An in-context learning model becomes interesting where that lifecycle costs more than inference:
| Situation | Why in-context learning holds up |
|---|---|
| Cold start: a few hundred labeled examples | Here it captures the extreme cases better, but its typical prediction is worse than CatBoost's |
| Many small problems: one model per client, site or region | A single service and contexts, instead of hundreds of pipelines to retrain and monitor |
| Labels arriving continuously | A new context row is taken into account on the next call, with no retraining |
| Right to be forgotten | Removing a row from the context is enough, whereas a trained model has to be retrained |
| Rare, batch, high-value predictions | 25 s doesn't matter for an annual energy audit. That's in fact the case for this dataset |
| Baseline on barely prepared data | A quality reference in minutes, to decide whether a dedicated pipeline is worth the effort |
Conversely, at high request volume, with stable data and many labels, a trained model wins on every front. The right criterion isn't “Kumo or XGBoost” in the abstract. It's the cost per call times the number of calls, against the cost of owning a training pipeline.
This table is a piece of reasoning, not a measurement. Only the first row was tested here, and it turned out more nuanced than expected.
What's left to the craft
If training becomes a commodity, two things remain that neither CatBoost nor Kumo does for us.
Knowing the data. The synthetic-context bug is the example. It wasn't a model problem, it was a wrong physical ratio. The harmonization of the 2017–2019 years is another. Seattle's open data doesn't have the 2016 CSV's schema: I had to reconstruct columns by matching 3,194 common buildings, then filter out aberrant declarations that were nonetheless marked compliant (one building declares 278 times its previous year's consumption). Without that work, the R² for an entire year collapses.
Interpreting the results. CatBoost offers native variable importance and exact SHAP values, thanks to its tree structure. Kumo has nothing of the sort. You need an agnostic method: permutation importance. You shuffle a variable across the test buildings and measure how much the error rises. Thanks to batch processing, it's feasible: 17 variables, 3 permutations, 2 targets, about an hour of compute.
- CatBoost
- Kumo-Tabular
- CatBoost
- Kumo-Tabular
Both models agree on the essentials: floor area first, then the building's use. They diverge on the variable that describes that use. CatBoost relies on property type, Kumo on primary use. These two columns overlap, except for certain buildings. The test data center is classified “Other” in property type and “Data Center” in primary use. CatBoost sees it as an “other”, Kumo as a data center, and it's on this building that Kumo makes its lead. Kumo also spreads the importance over more variables: second-use area, parking, number of floors.
On emissions, natural gas connection comes just after floor area for both models. For CatBoost, it's even the top variable according to SHAP (28% of the importance, against 27% for floor area). District steam weighs too. That's consistent with the physics of the problem: Seattle's electricity is mostly hydro, so low-carbon. The emissions come mainly from combustion, on-site for gas or in the steam network's boiler houses. The models recover what an energy engineer knows. It's reassuring, and it's also the limit of the exercise: they see only what the variables describe.
A context-based model could offer another explanation: “this building looks like those ones”. I didn't find how Kumo-Tabular would expose those influential examples.
What I take away
What remains open
- A larger test set, or per-building cross-validation, so that three buildings no longer decide the ranking.
- Tuning CatBoost at each set size, instead of reusing the hyperparameters tuned for 1,236 rows.
- Genuinely new buildings beyond 1,236 rows, rather than other years of the same ones.
- Shared similarity-based contexts, pooled across nearby buildings, to keep the gain from neighbors without losing batch processing.
Links
- Code, documentation and technical decisions: OC-P5 on GitHub
- Published CatBoost model: seattle-energy-catboost on Hugging Face
- Online demo: seattle-energy-demo
- Kumo-Tabular: NVIDIA structured-data-models
- Data: Building Energy Benchmarking, Seattle open data
On the map
- LLM Summarizer Trainerproject
- OC-Ai-Engineer-P3project
- Fashion Trend Intelligenceproject